Summary:
The PartReg computer program (model) is designed
to perform a partial segmented linear
regression of one dependent variable
(Y, e.g. plant growth, crop yield) on one (X)
independent (explanatory) variable
(predictor), e.g. crop growth factors like depth
of water table and soil salinity with the aim to
find the water table and salt tolerance level,
also called the "no effect" range or plateau.
|
Details:
The segmentation is done by introducing a
breakpoint and finding the stretch (at the
beginning or at the end of the X-domain over
which the Y-X relation can be considered
horizontal, i.e. Y is not influenced by X. The
regression coefficient (i.e. the slope of the
line over the selected stretch) may not be
significantly different from zero in statistical
sense.
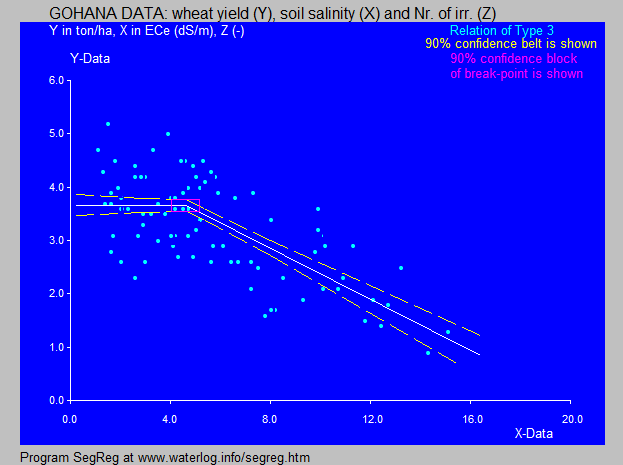
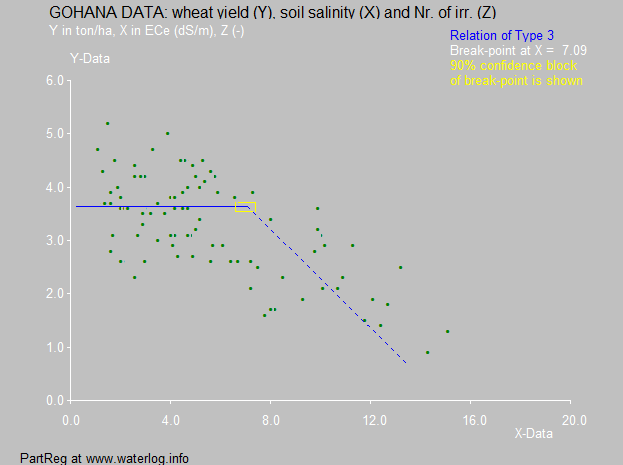
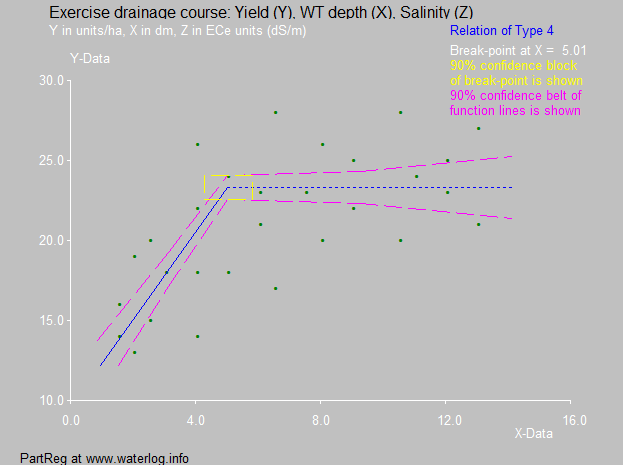
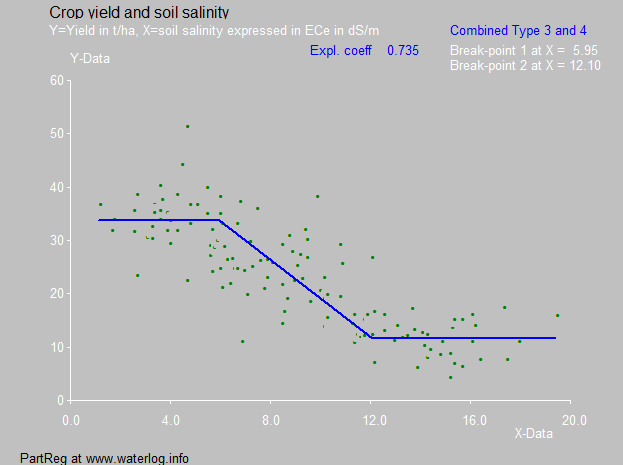
Two types of functions (3 and 4) are used.
In Type 3 the horizontal line (plateau) is
followed by a sloping line whereas in type 4
the sloping line is followed by a horizontal
line (plateau).
The horizontal line (plateau) is found by partial
regression over the head end (Type 3) or
the tail end (Type 4) of the X domain.
|
Difference with SegReg:
The PartReg program is similar to
SegReg. However, SegReg
minimizes the deviations of the calculated
values from the observed values over the entire
domain and comes with a broken line fitting all
data as well as possible. PartReg, on the other
hand considers only that part of the domain
over which the relation is horizontal. As a
result the stretch over which the line is
horizontal is usually longer than with SegReg,
but the fit of the data in the sloping segment
is not so good.
An illustration of the difference follows. For
more examples see
this article on
page 13 and following.
At the bottom of this page an example is shown
of the ability of PartReg to use three
segments, instead of two, in which the first
and the last segments show horizontal lines.
|
Examples:
The salt tolerance (or response) of field
crops under farming conditions in irrigated
lands is analyzed in this
tolerance paper for
cases in Egypt, India, and Pakistan.
The sensitivity of field crops under farming
conditions for shallow water tables is analyzed
in this
sensitivity paper
analyzing the tolerance of banana, cotton,
sugarcane and wheat too elevated watertables.
An article entitled "Salt tolerance of crops,
statistical analysys of data measured in farm
Lands" on the use of PartReg as one of the
methods for the assesement of crop tolerance to
soil salinity has been published in the
International Journal of Agriculltural Science,
which can be found on this website.
The Salt Farm Texel has published a paper on a
methodology to evaluate crop salt tolerance
from field trials, which I find unacceptable.
My comments on this paper can be found in:
this report.
Examples of the range of no effect of an
influential variable on a response variable is
to be seen in
this paper.
|
Experiences:
For improvement, I am interested to learn about
your experiences with PartReg. For this there is
a contact form.
|
|
Download:
PartReg
Go to:
Software
& models
General articles
& manuals
Artiículos
(in Spanish,
en Español)
Published
reports & cases
Particular
reports & cases
FAQ's
& answers
Home
page
|