|
|
In the case studies below, the following references
are used:
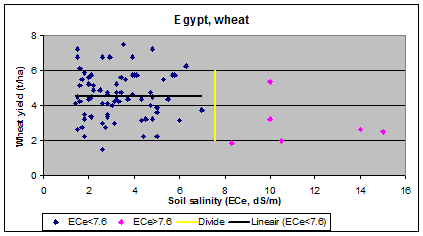
1 - EGYPT
H.J. Nijland and S. El Guindy (1982), Crop yields,
watertable depth and soil salinity in the Nile Delta,
Egypt.
In: Annual report 1983, p. 19-28. International
Institute for Land Reclamation and Improvement (ILRI),
Wageningen, The Netherlands.
See: Egypt article
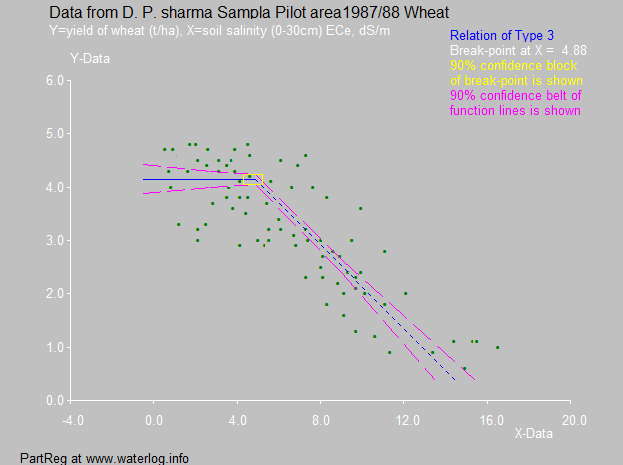
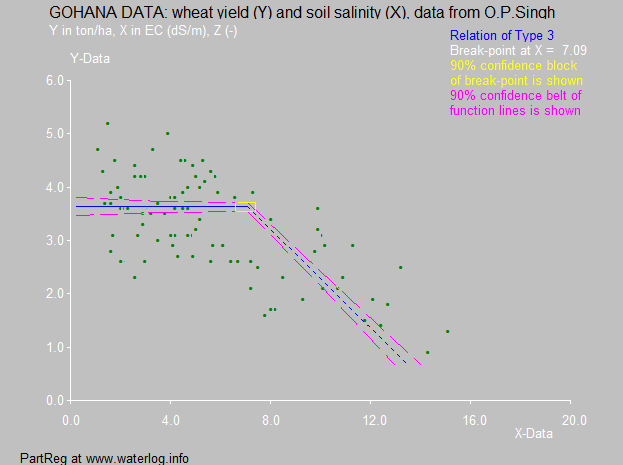
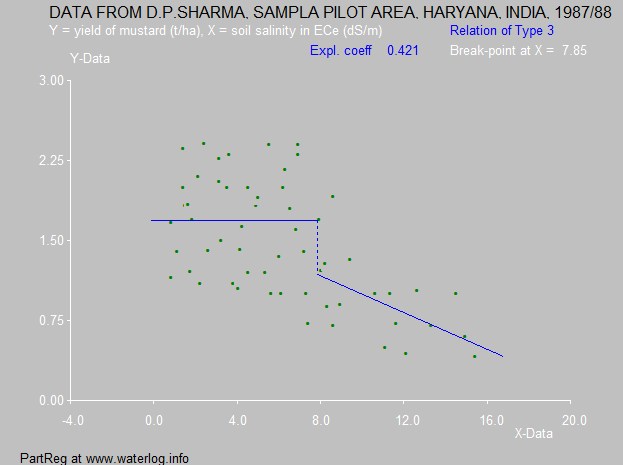
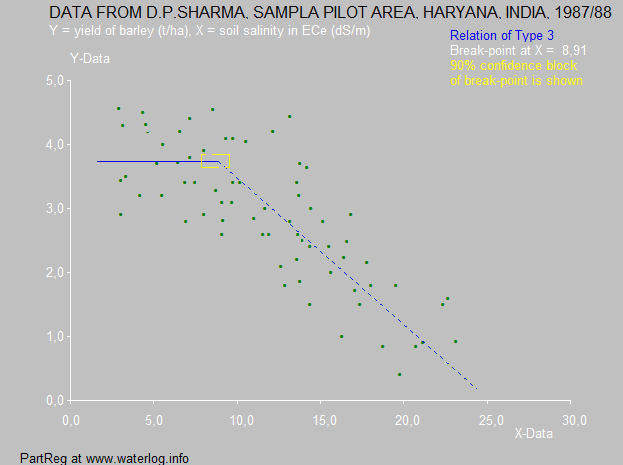
2 - INDIA
D.P. Sharma, K.N. Singh and K.V.G.K Rao (1990),
Crop Production and soil salinity: evaluation of field
data from India. Paper published in Proceedings of
the Symposium on Land Drainage for Salinity Control in
Arid and Semi-Arid Regions, February 25th to March 2nd,
1990, Cairo, Egypt, Vol. 3, Session V, p. 373 - 383.
See: India article
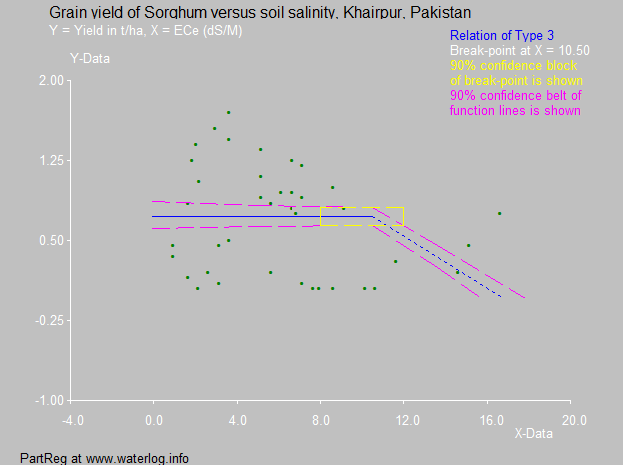
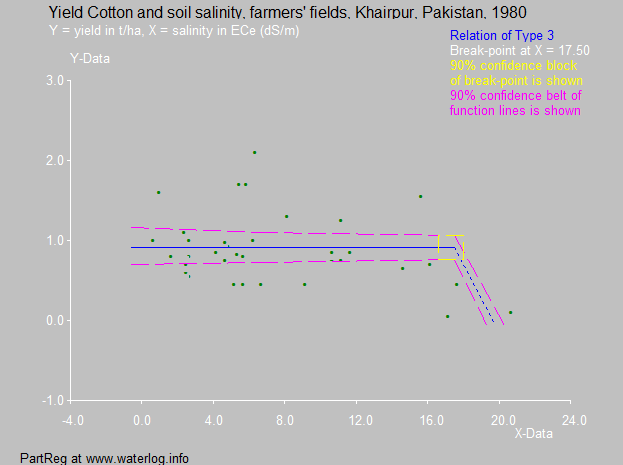
3 - PAKISTAN
R.J. Oosterbaan (1980), Crop yields, soil salinity
and watertable depth in Pakistan. In: Annual Report
1981, p. 50-54. ILRI, Wageningen, The Netherlands.
Reprinted in Indus 24 (1983) 2, p. 29 - 33.
See: Pakistan article
NOTE 1
The soil salinity is expressed in electric conductivity
of an extract of a saturated paste (ECe) of a soil
sample in dS/m (millimho/cm).
NOTE 2
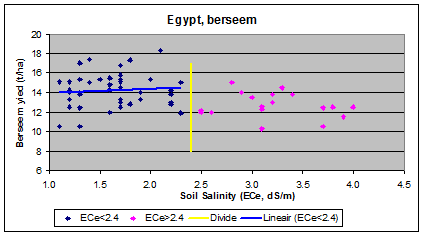
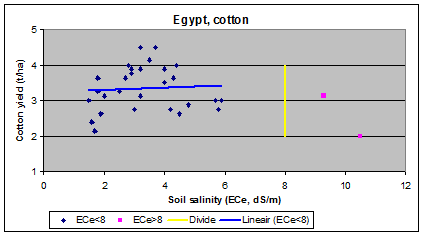
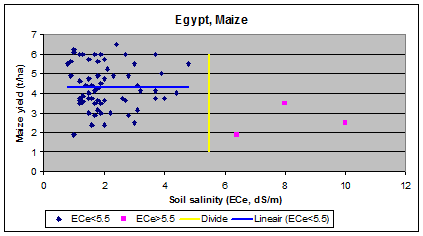
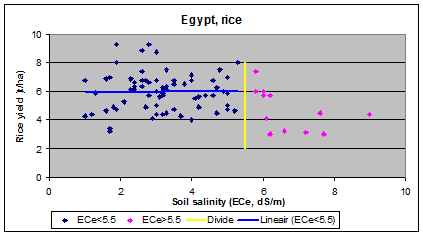
The figures for Egypt were made with Ms Excel, those
for India and Pakistan with
PartReg
NOTE 3
At the end, a summary of the crop tolerances is given.
NOTE 4
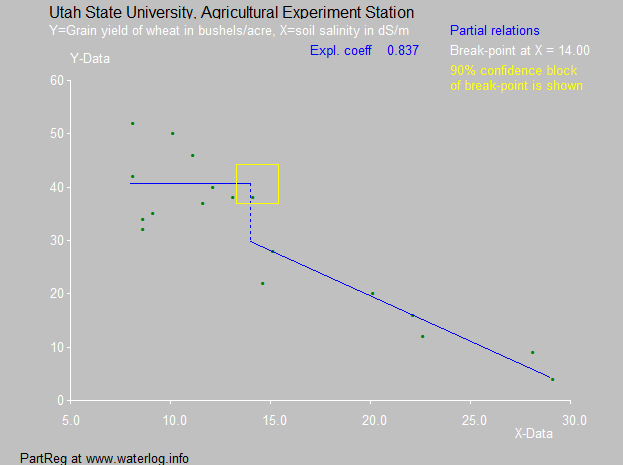
In the annex, a comparison is made wit data of the
Agricultural Experiment Sation of the Utah State
University.
|
Software
& models
Articles
& manuals
Reports
case studies
FAQ's
& answers
Home
page
Contact
form
|