Two-way Fisher F-test calculator for analysis of variance (Anova)
Entirely free download of software


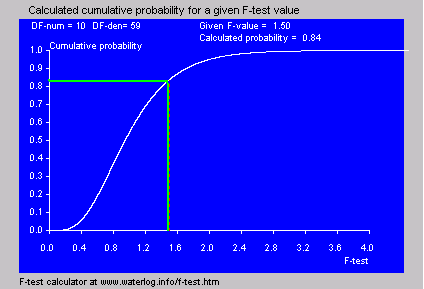
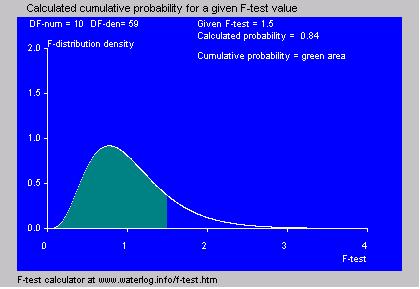
The F-test is used in analysis of variance (Anova) to test the difference between standard deviations under varying conditions.


The calculator program gives the probability of an F-test, given the F-value and
degrees of freedom of numerator (DF1) and denominator (DF2), and reversely
the value of the F-test given the probability.

For examples see: Anova table.


Screenprint of the two-way Fisher F-test calculator model:
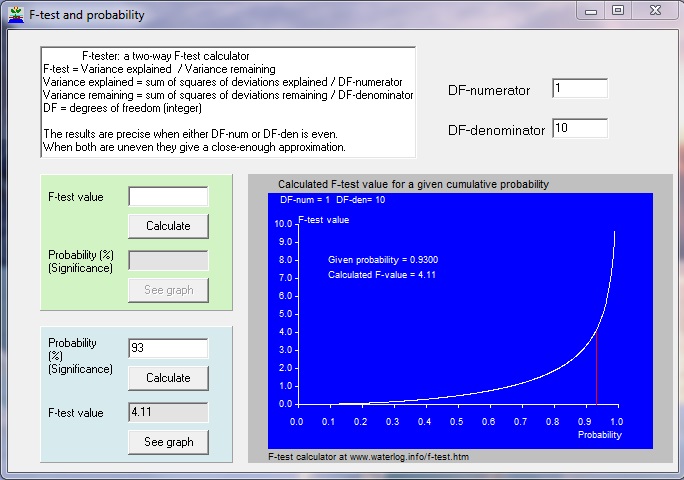
here comes an image    
Experiences: For improvement, I am interested to learn about your experiences with F-test. For this there is a contact form.


Download:

F-test calculator
F-distribution calculator


Go to:


software
& models


articles
& manuals


reports
case studies


FAQ's
& papers


home
page
   

            More examples of F-test model graphics in the F-test calculator software

            cumulative normal distribution
            In the F-test calculator model Fisher's cumulative
            F-distribution is used
            normal density distribution
            In the F-test calculator software Fishers's density
            F-distribution is used

MATHEMATICS

Reference: Abramowitz and Stegun, page 946

A numerical solution of Fisher's F- probability distribution is obtained when either DF1 or DF2 is even.
When both are even, use the smallest. When both are uneven (odd) an approximate solution is to be found.

DF1 is even

        Pe = sn/2 [ 1 + n.t / 2 + n (n+2) t2 / 8 + n (n+2) (n+4) t3 / 48 + n (n+2 ) (n+4) (n+6) t4 / 384 . . . . . ]

where:

s = n / (n+m.f), t = 1-s, m = DF1, n = DF2, f = F-test value determined from measurements.

Pe = probability of exceedance of the true F-test value over the reference (measured) F-test.

The series of denominators 2, 8, 48, 384 . . . equals the series 2, 2x4, 2x4x6, 2x4x6x8 . . .

The number of terms between the parentheses [ ] to be used is n / 2.

DF2 is even

        Pe = 1-tn/2 [ 1 + n.s / 2 + n (n+2) s2 / 8 + n (n+2) (n+4) s3 / 48 + n (n+2) (n+4) (n+6) s4 / 384 . . . . . ]


DF1 and DF2 are uneven (odd)

The above equations for Pe are, apart of f, a function of m and n, and can be represented as Pe(m,n).

When DF1=m and DF2=n are both uneven (odd), the ecxceedance probability Pe(m,n) can be approximated by non linear interpolation between Pe(m,n-1) and Pe(m,n+1).
The interpolation can be done with a weight factor (w):

        Pe(m,n) = { w.Pe(m,n+1) + Pe(m,n-1) } / (1+w)

Using w=3 one finds a reasonable approximation.


here comes an image


here comes an image


here comes an image


    The flowers are here
    to make the mathematics
    less boring.