t-Tester, two-way calculator for Student's t-distribution with graphics
  Entirely free download of software


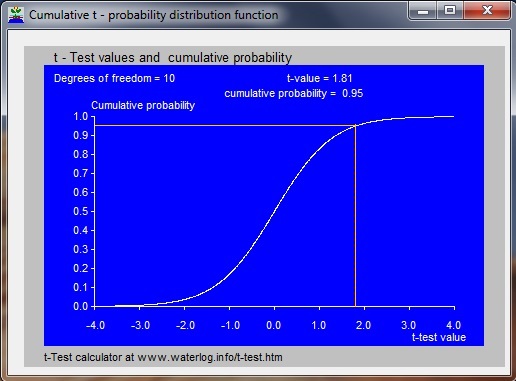
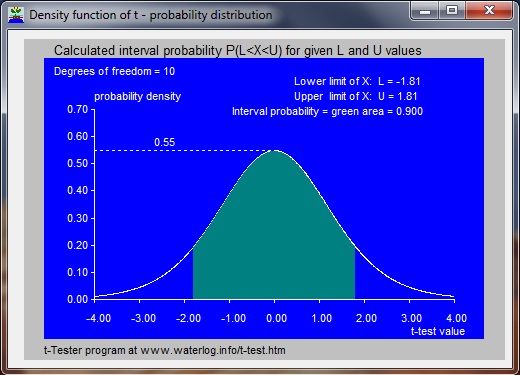
t-Tester is a calculator program using a model application (app) made with Delphi software
for calculations with Student's t-distribution and performing the t-test.


The difference between means (averages) of different samples from normally distributed random variables may, when divided by the standard deviation, follow a Student (t) probability distribution with N degrees of freedom. This property is used in the t-test by which it can be found whether the averages from different samples are significantly different or not.

With Student's t-distribution one can calculate the cumulative probability (Pc) of any reference X-value (T, the t-test value), or, reversely, one can find the t-test value for any Pc.

Pc(T) is the probability (P) that an X-value is less than the reference t-test value T : Pc(T) = P(X < T).

The probability (P) that X occurs between a lower limit (L) and an upper limit (U) can be found from:
P(L < X < U) = Pc(U) - Pc(L).
Using L=-5, and Pc(L) = Pc(-5) = 0, one finds P(L < X < U) = Pc(U).

The exceedance probability (Pe), being the probability that X is greater than t-test value equals 1 - Pc. Hence, when Pc is known, the Pe is also known.

Screenprint of t-Tester, the two-way model calculator for the t- (probability) distribution:
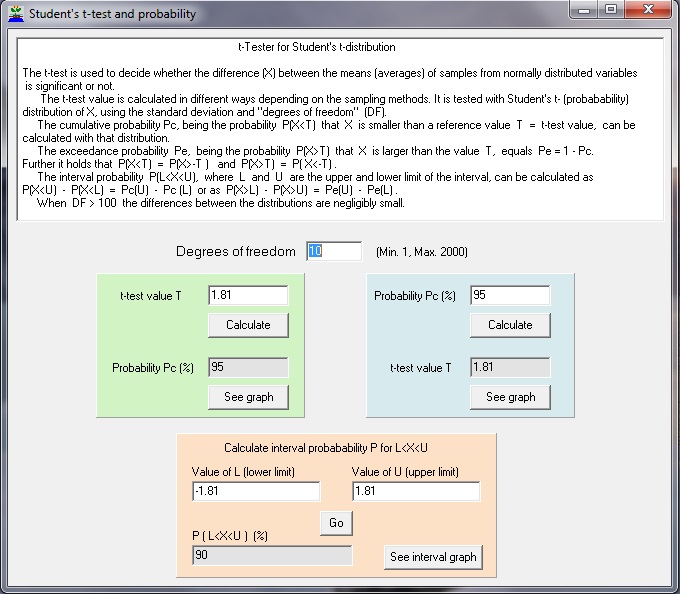
               
Screenprint t-test calculator

Experiences: For improvement, I am interested to learn about your experiences with t-Tester.
For this, there is a contact form.


Download:

t-Tester
t-distribution calculator


Go to:

software
& models

articles
& manuals

reports
case studies

FAQ's
& papers

home
page
 

        t-Tester software graphics in accordance to data in the above screenprint of the calculator

        T-test cumulative distribution
        The cumulative t-distribution of Student is used
        in the T-tester model calculator to test the difference
        between the means of data sets.
T-test density function
The confidence interval of the difference of mean values of
data series is shown in green color. This interval is used
by T-tester model calculator in Student's t-test

MATHEMATICS

The t-Tester software model uses a numerical solution of the cumulative t- distribution function and from that it derives the t- probability density by numerical differentiation.  

Numerical approximation of Student's t- (probability) distribution.

Using:
        T = reference value for the X-variable following the t-distribution, Po = intermediate probability variable,
        Pc(T) = cumulative probability of T, and Pc(T) = P(X < T) ,
the following equations hold:

N (degrees of freedom) even :

        Po = sin(z) [1 + cos2(z) / 2 + 3 cos4(z) / 8 + 15 cos6(z) / 48 + 105 cos8(z) / 384 + . . . ]

N (degrees of freedom) uneven (odd) and >1 :

        Po = 2Z/pi + (2/pi)cos(z).sin(Z) [1 + 2 cos2(z) / 3 + 8 cos4(z) / 15 + 48 cos6(z) / 105 + . . . ]

N (degrees of freedom) = 1 :

        Po = 2z / pi

where :
        z = arctan(T / sqrt(N) , and pi = 22 / 7

Now :
        when T is positive: Pc(T) = Po + (1-Po) / 2
        when T is negative: Pc(T) = (1-Po) / 2

The number of terms between the parentheses [ ] to be used is N / 2 when N is even and (N-1) / 2 when N is uneven (odd).


here comes an image

here comes an image

here comes an image

    The flowers are here
to make
    the mathematics
    less boring.